H2 Maths Linear Regression Application in Stocks
-
I'll be sharing here a little of my analysis on STI index using the things learned in H2 Maths: Linear Regression
We have here the following data from the monthly charts (interim peaks and bottoms):
Mar 1994 (zeroth month): 2482.9
Feb 1996 (23rd month): 2504
Mar 2000 (72nd month): 2582.94
May 2006 (145th month): 2666.33
Mar 2008 (168th month): 2745.96In my linear regression analysis, the variable x shall represent the number of months after Mar 1994. The variable y is the value of STI, excluding inflation.
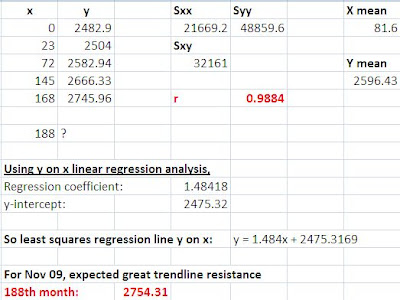
A simple excel calculation when we consider the linear chart:As we can see, the calculations point to 2754.31 as the resistance for this month, Nov 2009, the 188th month since Mar 1994.
The linear product correlation for both the linear stands at a high 0.988, signifying a very strong linear correlation between the Straits Times Index and time line. -
Hi eagle,
That's a wonderful sharing of how maths can be used to forecast trends :)
Thanks!
Cheers,
Wen Shih -
ZOMG SO MANY NUMBERS.
blur diaoz
-
As hard as I tried, I have never had a R squared of more than 0.6

-
Originally posted by eagle:
I'll be sharing here a little of my analysis on STI index using the things learned in H2 Maths: Linear Regression
We have here the following data from the monthly charts (interim peaks and bottoms):
Mar 1994 (zeroth month): 2482.9
Feb 1996 (23rd month): 2504
Mar 2000 (72nd month): 2582.94
May 2006 (145th month): 2666.33
Mar 2008 (168th month): 2745.96In my linear regression analysis, the variable x shall represent the number of months after Mar 1994. The variable y is the value of STI, excluding inflation.
A simple excel calculation when we consider the linear chart:As we can see, the calculations point to 2754.31 as the resistance for this month, Nov 2009, the 188th month since Mar 1994.
The linear product correlation for both the linear stands at a high 0.988, signifying a very strong linear correlation between the Straits Times Index and time line.Hi Eagle,
Great, this is a fun way to teach linear regression to the students.
May I know where do you get all the data ?
I would like to teach my students linear regression using your example with the data and the regression line Value of STI Index = a + b(number of months after March 1994) too.
Thanks.
Regards,
Lee012lee
-
Hi Lee012lee,
The data were sourced from yahoo data. My full analysis included logarithmic charts, and the points were picked from this
Only 1 of the points was not labelled.
For trends, it is expected to be highly correlated. So the high value of r is expected. -
Originally posted by eagle:
Hi Lee012lee,
The data were sourced from yahoo data. My full analysis included logarithmic charts, and the points were picked from this
Only 1 of the points was not labelled.
For trends, it is expected to be highly correlated. So the high value of r is expected.Hi Eagle,
Thanks a lot for the source of the data.
This will definitely help to make my lessons more interesting to my students.
Regards,
Lee012lee
-
Originally posted by eagle:
Hi Lee012lee,
The data were sourced from yahoo data. My full analysis included logarithmic charts, and the points were picked from this
Only 1 of the points was not labelled.
For trends, it is expected to be highly correlated. So the high value of r is expected.Ok, now I see why the your R squared is so high.

